
The problem is to find the domain and range of a function shown in a graph. I need to use interval notation. First, I'll recall that the domain is all possible x-values, and the range is all possible y-values for the function.
Looking at the graph, it seems like a curve that starts from the left, goes up, and then stops at a point. The graph has a solid dot at (1,0) and an open dot somewhere, but I need to be precise.
From the description, the curve starts at the top-left, goes down and to the right, and ends at (1,0) with a closed dot. That means x can be from some value up to 1, and y starts from some high value down to 0.
Let me sketch this mentally. The x-axis goes from -5 to 5, y from -5 to 5. The curve begins near (-5,4) or so, extends to (1,0). It's a decreasing function, I think.
The domain is all x-values the function takes. Since the curve starts at x = -5 (or slightly more, but assuming it's continuous from the leftmost point) and goes to x = 1, and includes x=1 (closed dot), the domain should be from -5 to 1.
But is x=-5 included? The graph might not have a defined value at x=-5, but since it's a continuous curve starting from there, probably it's included. Wait, no, in graphs, if there's no endpoint mark, but it's a smooth start, it might be included. But in this case, since it's going off to the left, and no open dot, I think x can be less than or equal to 1, but how far left?
Looking back at the image, the curve starts at approximately x = -5, y = 4, and as x increases, y decreases, reaching (1,0). Since there's no indication that it stops before x=-5, and it's a continuous curve, the domain should be all x ≤ 1, but x starts from -5? No, in interval notation, I need the smallest x.
Actually, the leftmost point of the graph is at x = -5, and since it's a continuous curve without breaks, the domain is from -5 to 1, inclusive.
But is x=-5 included? The graph shows the curve starting at (-5,4), and since there's no open circle, it's probably included. Similarly, at x=1, there's a closed dot, so included.
So domain: [-5, 1].
Now for the range. The y-values: at x=-5, y≈4, and as x increases, y decreases to 0 at x=1. So the highest y is 4, and lowest is 0. Since it's decreasing and continuous, y goes from 4 down to 0, inclusive.
At x=-5, y=4, and at x=1, y=0, and since it's a continuous decrease, all y-values between 0 and 4 are covered. So range should be [0,4].
But is y=4 included? At x=-5, if it's a point on the graph, yes. And y=0 at x=1, included.
So domain: [-5, 1], range: [0,4].
But let me confirm with the graph. The user mentioned "the function", so it's a function, meaning for each x, only one y, which it is, since it's decreasing.
Also, in the range, is there any part where y is above 4 or below 0? From the graph, no, it starts at y=4 and goes down to y=0.
But at x=-5, y=4, and as x increases, y decreases, so maximum y is 4, minimum is 0.
So interval notation: domain is [-5, 1], range is [0,4].
But let me make sure about the endpoints. At x=1, y=0, closed dot, so included. At x=-5, assuming it's a closed point, but the graph might not show a dot, but since it's the start of the curve, and no open circle, it should be included.
Similarly for y.
So I think that's it.
To determine the domain and range of the function from the graph:
-
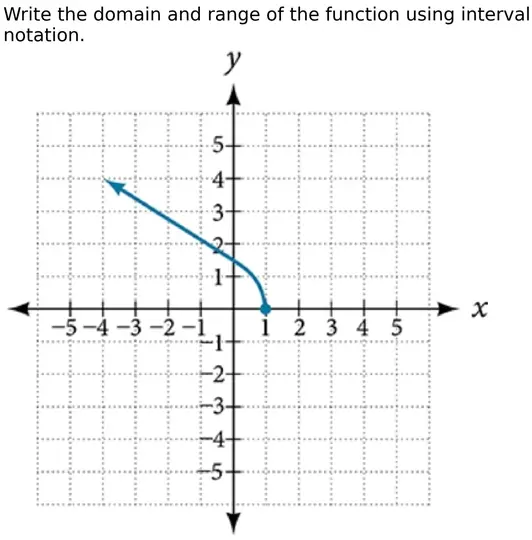
Domain: The set of all possible x-values. The graph extends from x=−5 to x=1, with a closed dot at (1,0) (indicating x=1 is included) and no indication of exclusion at x=−5 (the curve starts continuously at x=−5). Thus, the domain is [−5,1].
-
Range: The set of all possible y-values. The graph decreases from y=4 (at x=−5) to y=0 (at x=1), with both endpoints included (no open dots). Thus, the range is [0,4].
Domain: [−5,1]
Range: [0,4]